ICT Trading Roadmap 2025 – Learn ICT Concepts in the Correct Order (Beginner Guide)
- Published On: 30/09/2025

Join Our Telegram Channel

If you’ve ever tried learning ICT (Inner Circle Trader) concepts, you probably felt lost in a jungle of terms — market structure, order blocks, fair value gaps, breaker blocks, liquidity sweeps… it all sounds powerful, but without a clear sequence it becomes overwhelming. Many beginners binge-watch videos, take random notes, and still ask: “Where do I even start, and what comes next?”
That’s exactly why an ICT Trading Roadmap is needed. Think of it as your Google Maps for trading: it shows you the starting point (Market Structure), the destination (Liquidity targets), the pathways (Fair Value Gaps), the fuel stations (Order Blocks), the precision lane (OTE retracements), and even the GPS timing (Killzones & sessions). Add proper risk management, and suddenly, you’re not wandering — you’re driving with purpose.
This guide is built for 2025 learners who want simple explanations, real chart logic, and a step-by-step roadmap that connects all ICT pieces together. It draws from ICT mentorship teachings, chart backtesting on Forex and Gold (XAUUSD), and my own structured learning notes.
By the end, you won’t just know the definitions — you’ll know the order of learning and how to apply it, so every concept supports the next. Whether you’re preparing for a prop firm challenge like FTMO or simply building consistency, this roadmap will give you the direction, clarity, and confidence you’ve been missing.
Most beginner traders start trading without a clear plan. They jump straight into concepts like Order Blocks (OBs) or Fair Value Gaps (FVGs) without understanding the basics. The result? Confusion, random trades, and repeated mistakes.
Think of trading like building a house. Would you paint the walls before laying the foundation? Probably not. But many traders do this with ICT concepts — trying to apply advanced ideas before understanding Market Structure or Liquidity. Without a proper roadmap, all the knowledge becomes scattered puzzle pieces, hard to connect.
An ICT Trading Roadmap solves this problem by giving you clarity and sequence. It shows you where to start, what comes next, and how everything fits together. For example:
Following this roadmap gives you a step-by-step framework. You no longer trade randomly or hop between strategies. Each trade has a logical path from analysis to execution. Over time, the roadmap turns complex ICT concepts into a clear workflow, helping you trade with confidence and consistency.
In short: a roadmap is your trading GPS — without it, you’re guessing; with it, you know exactly where to go, what to watch, and how to act.
Before you dive into Order Blocks, Fair Value Gaps, or any advanced ICT concepts, you need to understand Market Structure. Think of it as the map of the city before you start driving — without it, you’ll get lost no matter how good your car or GPS is.

Market Structure Foundation
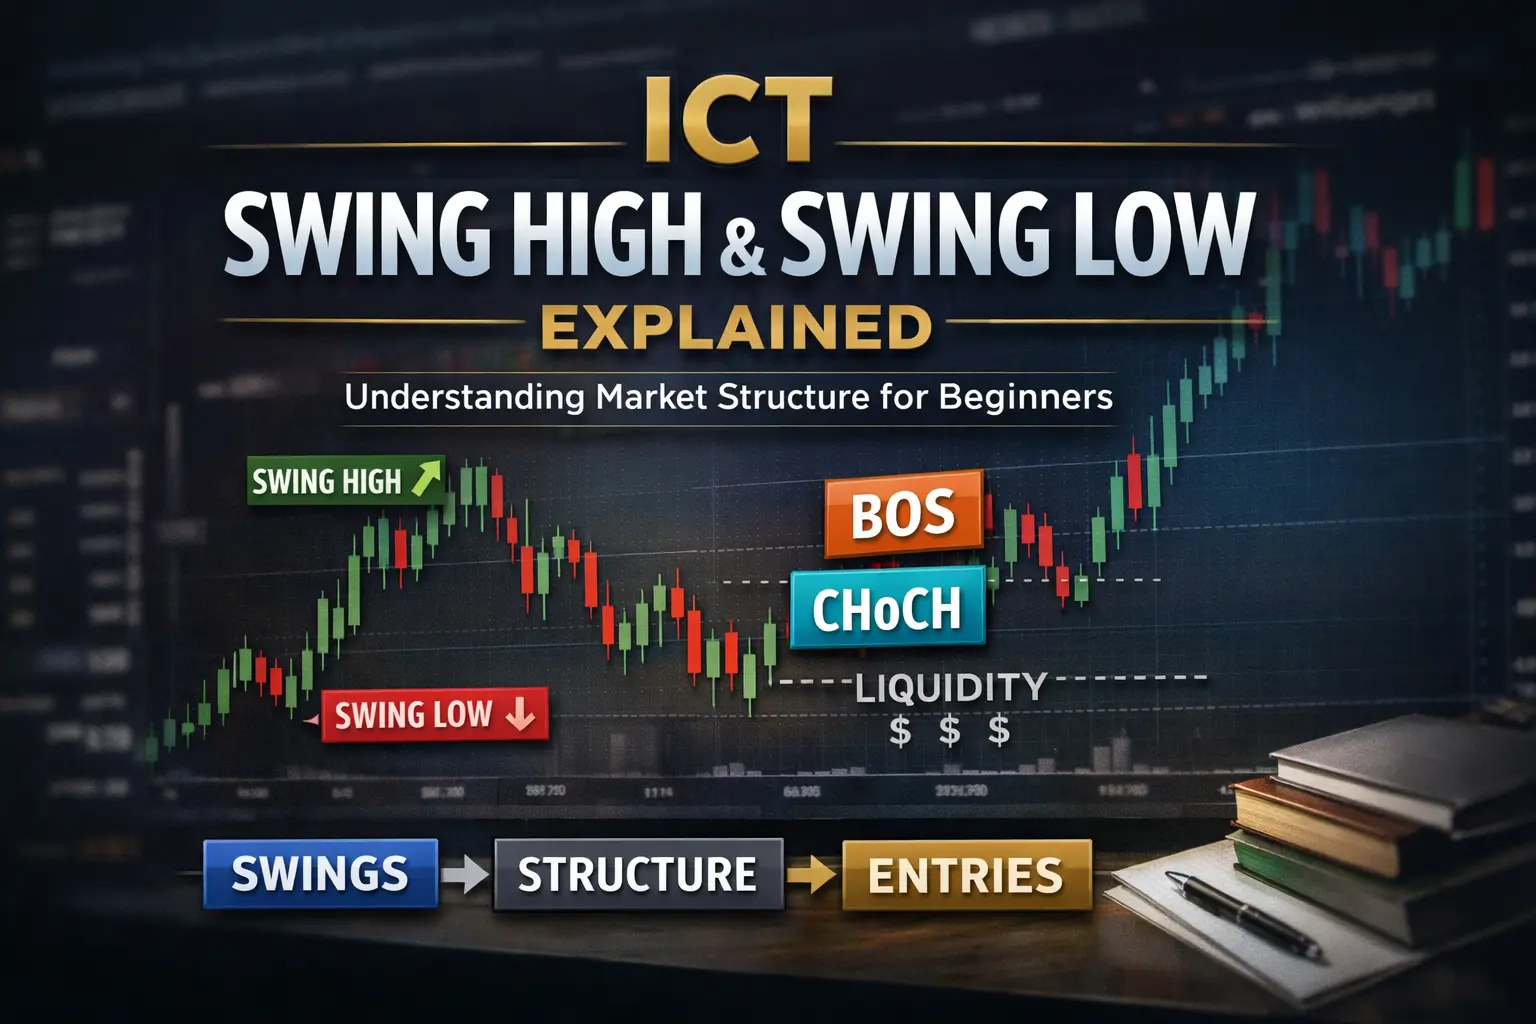
Market Structure is simply the pattern of swing highs and swing lows that tells you whether the market is bullish, bearish, or ranging. In ICT terms, it includes concepts like Higher Highs (HH), Higher Lows (HL), Lower Highs (LH), Lower Lows (LL), and Market Structure Shifts (MSS).
Imagine trying to trade an Order Block without knowing the market’s direction. You might enter a “perfect” OB, but if it’s against the trend, the probability of success drops significantly. Market Structure gives context: it tells you which side of the market to favor.
While studying ICT charts, label every swing high and low. Draw arrows for the trend direction. This will help you visually connect Market Structure to Liquidity zones, OBs, and FVGs later.
Spend 10–15 minutes daily on chart review. Focus only on identifying market structure. Once this becomes second nature, adding advanced concepts becomes intuitive. You’ll start seeing why price reacts at certain zones, where smart money collects liquidity, and which trades align with the trend.
Market Structure is your foundation — the first piece of the roadmap. Everything else builds on it: liquidity zones become meaningful, OBs and FVGs align with the trend, and your OTE entries gain context. Without mastering structure first, the roadmap doesn’t work.
Bottom Line: Never skip this step. Market Structure is the “lens” through which all ICT concepts make sense. Master it, and every trade becomes a logical, high-probability decision rather than a guess.
Once you understand Market Structure, the next question is: where is price trying to go? This is where Liquidity comes into play. Think of it as the destination on your trading map — knowing the road (structure) is not enough if you don’t know where the market is heading.
Liquidity refers to areas on the chart where many traders place stop-losses, pending orders, or limit entries. Smart money (institutions) targets these zones to execute their large orders efficiently. In ICT terms, you’ll hear phrases like:
If price breaks a previous swing high and quickly reverses, that’s a liquidity grab. Institutions have collected orders above the high, then push price in their preferred direction. If you had entered blindly at that break, you might have been stopped out. Understanding liquidity saves you from these traps.
Liquidity is the destination — the “why” behind price movements. Market Structure tells you the road; Liquidity tells you where the market wants to go. Without recognizing liquidity, entries into OBs, FVGs, or OTEs are often mistimed and high-risk.
Bottom Line: Mastering liquidity transforms your charts from random candles into a map of institutional activity. It’s a critical step in following the ICT roadmap correctly and trading with higher probability.
After you understand Market Structure (the map), Liquidity (the destination), and Fair Value Gaps (FVGs) (the pathways), it’s time to look at Order Blocks (OBs) — the engine rooms that power the market’s moves. Think of OBs as the fuel stations that keep price moving along the roadmap.
An Order Block is a zone where institutional traders placed large buy or sell orders before a strong directional move. These are usually the last bullish or bearish candles before an impulsive surge. In simple terms, OBs show where the big players entered the market, and these zones often act as future support or resistance.
Suppose EUR/USD forms a bullish OB at 1.1000–1.1010, then surges to 1.1050. Later, when price returns to 1.1000–1.1010, this OB acts as a high-probability entry zone. Pair it with an FVG and liquidity alignment, and your trade setup is stronger.
Order Blocks energize price moves — they are the engine rooms. FVGs (pathways) guide price, OBs power the movement, and liquidity (destination) pulls the trend. Skipping OBs can lead to entering trades too late or missing strong reaction zones.
Bottom Line: Mastering Order Blocks lets you see where institutional traders place their orders, providing cleaner, higher-probability setups. In the ICT roadmap, OBs are indispensable for turning analysis into actionable trade entries.
Once you’ve identified Market Structure, Liquidity, Fair Value Gaps, and Order Blocks, the next step is fine-tuning your entry — this is where Optimal Trade Entry (OTE) comes in. Think of OTE as the precision lane on the trading roadmap. It tells you exactly where to enter for the best risk-to-reward.
OTE is a retracement zone, usually 61.8% to 79% of a recent price move, often based on Fibonacci levels. It’s not just a random percentage — it’s where the market naturally pulls back before continuing its main move, giving traders a higher-probability entry.
Suppose EUR/USD surged from 1.1000 (OB) to 1.1050. Pull back occurs, and Fibonacci retracement shows 1.1020–1.1030 as the 61.8–79% OTE. If this OTE aligns with the OB zone and liquidity below, you have a high-probability entry with a clearly defined stop and target.
Bottom Line: OTE lets you enter trades with maximum accuracy and minimal risk. It’s the step that turns your roadmap analysis into actionable, high-probability setups. Without OTE, you might guess entries or enter too early, reducing your edge. Master this, and you’ll start seeing better, cleaner trade executions.
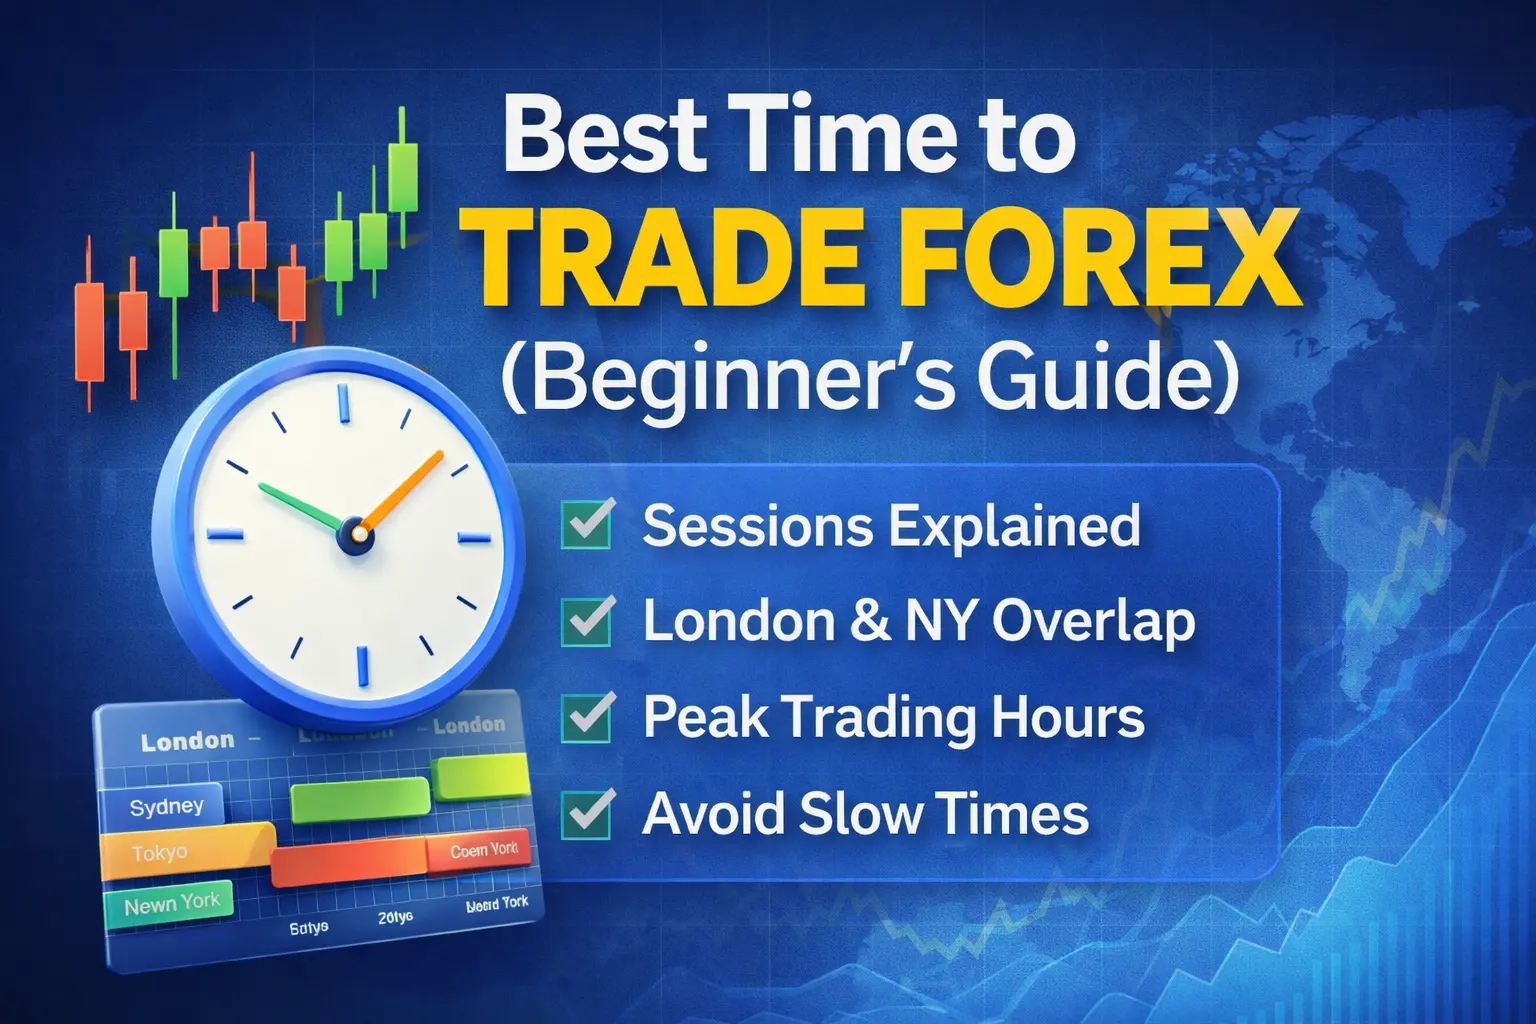
Understanding where to enter is crucial, but knowing when to enter can be just as important. Timing in ICT trading acts like the GPS for your trade roadmap — it helps you navigate the market efficiently and avoid unnecessary risks.
Even if your Market Structure, Order Blocks, Fair Value Gaps, and OTE are perfectly aligned, entering outside high-probability timeframes can reduce your chances of success. Price movement tends to be more predictable and volatile during certain sessions, giving you better opportunities to follow the roadmap.
Suppose GBP/USD shows a bullish Market Structure with a clear OB and FVG retracement zone. The best chance to enter might be during the London Open Killzone, when institutional liquidity is active. Entering hours before or after could reduce the effectiveness of your OTE setup and increase risk.
Bottom Line: Timing ensures you enter when the market is ready to move, not just where it could move. By combining timing with structure, liquidity, and OTE, you’re trading with both precision and momentum, dramatically increasing your chances of success.
Even with a perfect roadmap — Market Structure, Liquidity, FVGs, Order Blocks, OTE, and Timing aligned — trades can still fail. That’s why risk management is the guardrail keeping your trading account safe while you follow the roadmap. Without it, even the best setups can lead to heavy losses.
Many beginners focus only on finding the “perfect trade” but forget that one bad trade can wipe out weeks of progress. Consistent profitability comes not from winning every trade but from controlling losses and maximizing edge. Think of it like driving on a highway: you can see the route clearly, but guardrails prevent accidents when you make small mistakes.
Suppose EUR/USD aligns perfectly with your roadmap: bullish structure, FVG retracement, POI, and London Killzone timing. If you ignore risk management and risk 10% of your account on one trade, a small unexpected reversal could wipe out months of effort. By limiting risk to 1%, you survive the setback, learn from it, and continue applying your roadmap with discipline.
Bottom Line: Risk management is not optional — it is the foundation that allows the roadmap to work consistently. The best roadmap in the world will fail without proper guardrails.
Now that we’ve broken down the individual pieces — Market Structure, Liquidity, Fair Value Gaps (FVGs), Order Blocks (OBs), Optimal Trade Entry (OTE), Timing, and Risk Management — it’s time to see the full roadmap in action. For a beginner, the power of this framework is that it provides direction: you know exactly where to start, what to look for, and how to plan your trade from beginning to end.
Market Structure forms the foundation of every ICT trade. Ask yourself:
Without this context, OBs, FVGs, or liquidity zones become meaningless. Market Structure tells you the road you’re traveling on.
Once you understand the trend, look for where price is likely to move. Liquidity zones are clusters of stop orders above highs or below lows. Price often reaches these points to collect liquidity before continuing the main move. Think of liquidity as the fuel or checkpoints along your roadmap.
Next, check for FVGs — imbalances left by fast institutional moves. Price tends to retrace to these areas. FVGs act like pathways connecting structure to liquidity. They give you intermediate targets and potential retracement zones.
Order Blocks are where institutions have previously placed large trades. When price returns to an OB, you often see reaction or support/resistance. These zones energize your trade and become prime entry areas, especially when aligned with FVGs.
The OTE retracement (61.8%–79%) fine-tunes your entry within the OB + FVG framework. It ensures that your stop-loss is logical and your R:R is favorable. OTE is precision control on your roadmap.
ICT emphasizes session timing: London Killzone, New York Open, or PM session reversals. Timing aligns with high-probability windows, ensuring you enter when markets are most likely to move.
Finally, overlay risk management. Set stops beyond OBs or liquidity pools, stick to fixed % risk, and accept that losses happen. This protects your account while following the roadmap.
Result: Trades are no longer random. You have a sequence to follow, a visual roadmap from analysis to execution, which increases probability and builds discipline.
Bottom Line: When these pieces are connected in order, ICT trading becomes logical and repeatable. Beginners stop guessing and start trading with confidence, knowing exactly what step comes next.
Even with a clear roadmap, beginners often slip into common traps. Recognizing these mistakes early saves frustration, time, and money.
Many traders try to jump straight to Order Blocks or FVGs without understanding Market Structure first.
Beginners often label every FVG, OB, or liquidity area on the chart.
Trading setups outside ICT Killzones or key session times is a common pitfall.
Even with perfect analysis, overleveraging or placing stops arbitrarily destroys accounts.
Trading without reviewing your own performance leads to repeating mistakes.
Key Tip: Following the roadmap consistently is more powerful than memorizing terms or chasing setups randomly. Discipline compounds over time.
A: With deliberate study, consistent journaling, and demo practice, beginners often see meaningful improvement in 6–12 months.
A: Yes, but setups lose reliability. The roadmap works because it layers structure, liquidity, OBs, OTE, and timing, giving higher-probability trades.
A: No. The roadmap applies to Forex, Gold (XAUUSD), indices, crypto, and liquid stocks. Price mechanics are universal; adjust for volatility and timeframe.
A: Not necessarily. Most ICT concepts are price-action based. Fibonacci, OB/FVG drawing tools, or session timers help but are not mandatory.
A: Start with chart study and labeling (structure, OBs, FVGs), use demo accounts for micro trades, journal your actions, and review weekly for improvement.
The ICT roadmap provides a step-by-step sequence for trading. Avoid shortcuts, stay disciplined, and use it as your guiding map from analysis to execution.

Why ICT Trading? Scope, Myths & Step-by-Step Smart Money Guide
January 24, 2026

Connect with focused ICT learners on our Telegram. Get daily insights, updates, and clear guidance to simplify your trading journey.
Join Channel