Why ICT Trading Terms Confuse Beginners
When you start learning ICT trading (Inner Circle Trader / Smart Money trading) — the first thing you notice is the language. You see terms like:
- “Liquidity Pools, Order Blocks, Fair Value Gaps…”
- “POI, Mitigation, Market Structure…”
Beginners often feel overwhelmed and ask: “What does this even mean?” or “How do I use these on a chart?” Without understanding this language, charts remain confusing and trading feels random.
Common Beginner Mistakes
Common problems learners face:
- They try to memorize terms without context — so the words become noise.
- They see “Order Block” but don’t know why it matters in a trade.
- “FVG” is just a jumble of letters with no practical use.
- They get shaken out by stop runs or take trades against the daily bias.
Many learners give up here. The fix isn’t more memorization — it’s simple, meaningful definitions with chart examples and the way these terms connect inside a trade plan.
Complete ICT Trading Glossary — Simple Meanings + Examples
Below is a complete ICT Trading glossary written in easy language. For each term you’ll get:
- A simple one-line meaning
- An easy-to-relate analogy
- Why it matters for trading (how to use it)
1. Liquidity Pools
- Zones where many traders place stop losses or pending orders.
- Like fish gathering around food in one area of a pond — orders cluster in the same spots.
- Price often moves into these zones to trigger stops or collect liquidity before reversing. Smart money uses this to get fills and create momentum.
2. Order Blocks (OB)
- Areas where institutional orders were placed before a big move (supply or demand zones created by smart money).
- A large footprint in the sand — it tells you where something heavy passed through.
- Order Blocks act as future support or resistance. When price returns to an OB, it often reacts there — making it a potential entry or exit zone.
3. Fair Value Gaps (FVG)
- A price gap where the market moved quickly and skipped levels, leaving an imbalance.
- A fast train skipping a station — the skipped area is the gap.
- Price often returns to fill or “mitigate” that gap. Traders use FVGs as good places to look for retracement entries.
4. Point of Interest (POI)
- A high-probability entry zone where multiple elements line up (e.g., OB + FVG + structure).
- A traffic light at an intersection — it tells you where and when to act.
- Instead of trading everywhere, you focus on POIs that give better odds and clearer risk management.
5. Market Structure
- The pattern of highs and lows (Higher Highs, Higher Lows, Lower Highs, Lower Lows) that shows trend direction.
- Hills and valleys — they tell you if you’re going uphill (bullish) or downhill (bearish).
- Market structure tells you if you should favor buys or sells. Breaks in structure (BoS) indicate trend changes.
6. Mitigation / Mitigation Blocks
- The market returning to fix a past imbalance or inefficiency (often near an OB or FVG).
- Going back to step on a stair you missed to keep steady.
- Mitigation areas are natural retests where price can pause and offer cleaner entries.
7. Dealing Range (Balanced Range)
- A consolidation zone where smart money moves quietly before a breakout.
- The calm before a storm — the market builds energy in a small area.
- Breakouts from dealing ranges often produce strong directional moves; they are good to watch for momentum trades.
8. Liquidity Grab / Stop Hunt
- Price pushes into zones to trigger stop losses of retail traders before reversing.
- Shaking a tree to knock down fruit (stop losses) before gathering it.
- These false moves trap retail traders and give institutions needed liquidity to continue a move. Recognizing a liquidity grab helps you avoid acting too early or taking the wrong side.
9. Breaker Block
- A previous Order Block that got broken and then flips to act as support or resistance in the opposite direction.
- A broken gate that becomes a doorway in the opposite direction.
- Flipped zones are powerful retest points and often show reliable price reactions.
10. Daily Bias / Trend
- Overall market direction for the day based on higher time frame structure.
- Riding a river current — prefer moving with the main flow instead of against it.
- Trading with daily bias increases the probability of success and reduces conflict with larger participants.
11. Imbalance
- Price areas where buyers and sellers weren’t equal, leaving a one-sided push or gap.
- A scale tilted to one side — the market often returns to balance it.
- Imbalances (where FVGs exist) attract price back and become useful targets for retests.
12. Optimal Trade Entry (OTE)
- A favored retracement zone (commonly 61.8% – 78.6% of a move) where entries often offer improved risk/reward.
- The best timing to step onto a moving train — not too early, not too late.
- OTE gives traders an entry with tighter stops and higher potential reward.
13. Liquidity Above / Below
- Areas above recent highs (liquidity above) or below recent lows (liquidity below) where many stop orders or pending entries sit.
- Fruits hanging on high branches — the market reaches them to collect liquidity.
- Price often targets these pools to enable follow-through moves; knowing where they are helps anticipate price action.
14. Mitigation of FVG
- Price returning to fill a Fair Value Gap before continuing the trend.
- Returning to step on the stair you missed for balance.
- Use the FVG mitigation as a confirmation or a safer entry area.
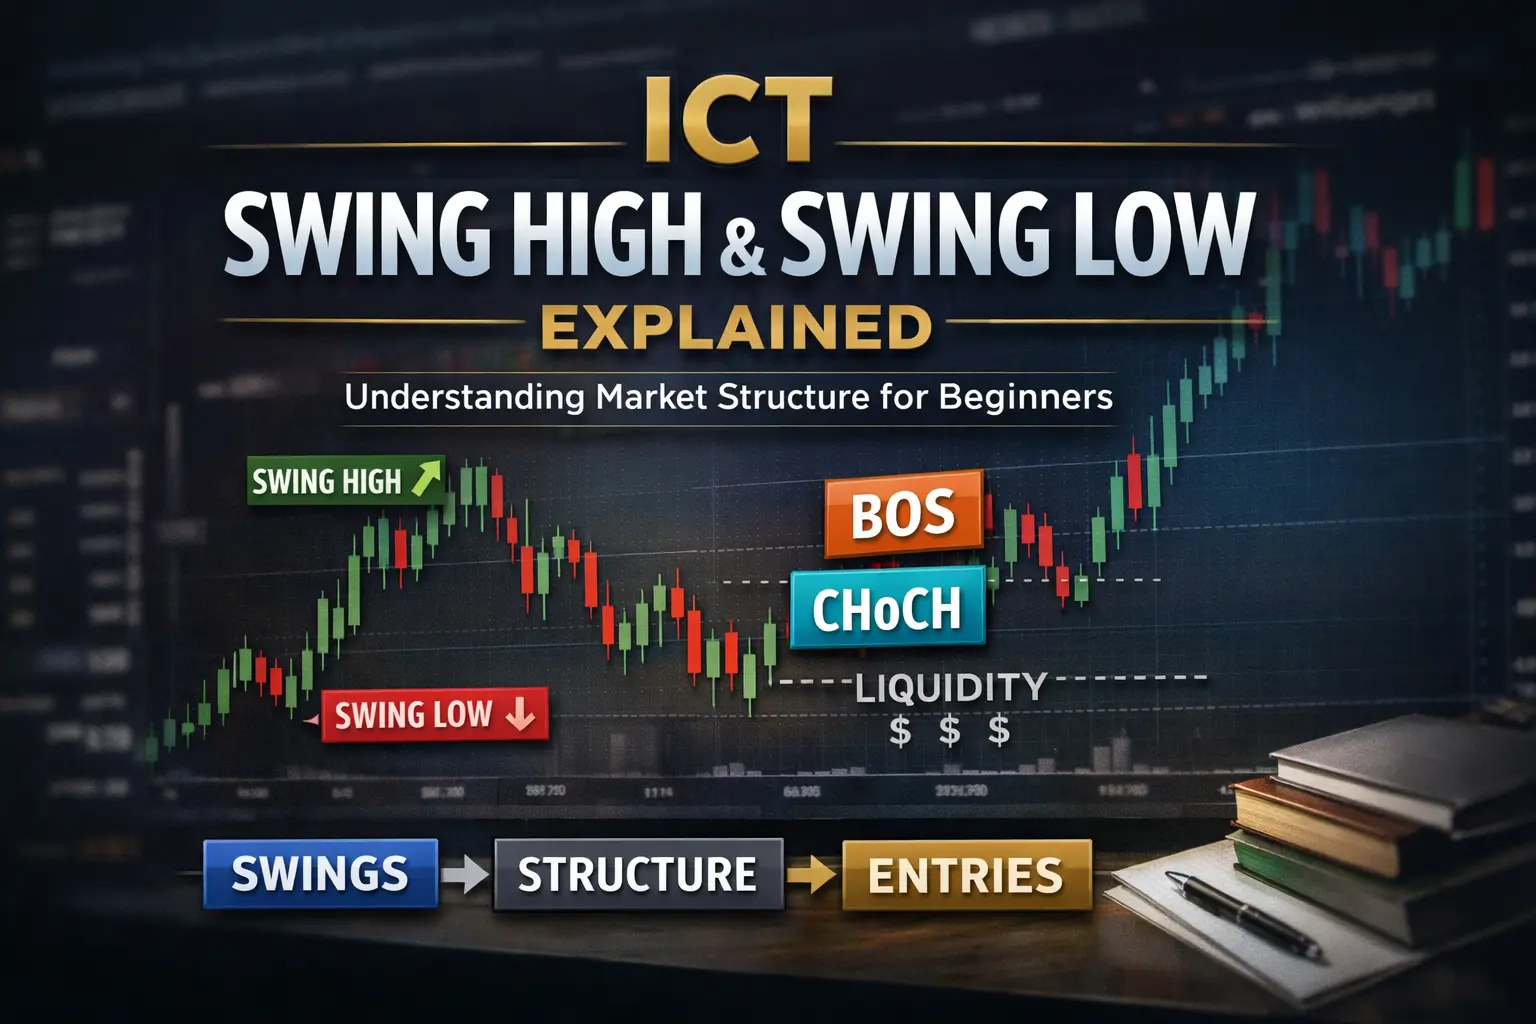
15. Swing High / Swing Low
- Local highs and lows in a short or intermediate price move.
- Mountain peaks (swing highs) and valleys (swing lows).
- They define structure, help find liquidity, and show breakout or retest levels.
16. Stop Run / Stop Hunt
- Intentional moves to trigger stop losses of retail traders (same as liquidity grab).
- Shaking the tree to knock fruits (stops) loose before the real move.
- Recognizing stop runs prevents emotional trading and helps identify where institutions may reverse price.
17. Break of Structure (BoS) / Market Structure Shift (MSS)
- A decisive break of a swing high or swing low indicating a trend change.
- Crossing a mountain ridge — once crossed, your outlook changes.
- Use BoS to re-orient bias and avoid trading against the new direction.
18. Accumulation / Distribution (Market Cycle)
- Phases where institutions quietly buy (accumulation) or quietly sell (distribution) before a major move.
- Quietly gathering or unloading goods before opening them to the public.
- Spotting these phases helps you know whether the market is preparing for a big rally or a drop.
19. Balanced Price Range (BPR)
- A consolidation zone after a displacement where buyers and sellers are in temporary balance.
- A tug-of-war paused in the middle before one side takes charge.
- A breakout from BPR typically produces strong directional moves; inside the BPR you find confluence areas.
20. Premium / Discount Zones
- Relative price zones above (premium) or below (discount) the midpoint of a recent range.
- Buying when something is on sale (discount) versus buying at full price (premium).
- If you’re buying in a trend, prefer discount zones. If selling, look for premium zones for better risk/reward.
Bonus Quick Terms
- CE (Consequent Encroachment): Often a midpoint trigger inside FVG.
- BISI / SIBI: Buy-side imbalance / Sell-side imbalance (describing where inefficiency sits).
- Killzones: High-probability time windows (e.g., London Open, New York Open).
- Displacement: A strong directional move after liquidity collection.
How These Terms Work Together — A Real Trade Flow
Knowing each term is only half the job. The power comes when you use them together. Below is a simple and repeatable trade flow showing how the terms join to form a plan.
Sample Long Trade (Step-by-step) in ICT Trading
- Daily Bias: Check the 4H/daily chart for Higher Highs / Higher Lows (bullish bias).
- Find Order Block: Identify a bullish Order Block below price — an institutional accumulation area.
- Locate FVG: Look for a Fair Value Gap above the OB. That gap represents an imbalance.
- Define POI: When OB + FVG + a swing low line up, mark it as your Point of Interest.
- Watch Liquidity: There may be liquidity below a recent swing low — price can dip to capture stops.
- Wait for Mitigation / Return: After a stop hunt or liquidity grab, wait for price to return to the POI (mitigation of FVG or retest of OB).
- Confirm Structure: Ensure there’s no Break of Structure against your bias.
- Enter via OTE: Use Optimal Trade Entry (61.8%–78.6%) inside POI for a safer entry.
- Risk & Target: Place stop below the swing low or OB. Target next OB, FVG, or liquidity above.
- Manage: Move stop to breakeven after partial profits and trail to capture more if price continues.
Why this helps: Each step refers to a glossary term. Over time, you’ll automatically recognize these patterns and plan trades with discipline instead of guesswork.
Common Variations
The exact order or number of elements can change — sometimes you’ll enter on an OTE without a visible FVG, or use a breaker block as your entry. The key is confluence: the more elements that align, the higher the probability.
How to Practice & Remember These Terms
Use simple study methods that are proven to stick:
- Label charts: While you perform chart study, mark OBs, FVGs, POIs, swing highs/lows, and mitigation zones.
- Make flashcards: Term on one side, meaning + example on the other.
- Journal each trade: After trading, map your entries to the glossary — what term helped, which one misled you.
- Teach a friend: Explaining the terms aloud cements your memory.
- Start small: Master 3 main terms first — Order Block, Fair Value Gap, Market Structure — then add two more every week.
Practice Routine (Simple 7-day plan)
- Day 1: Read this glossary and highlight the 3 terms you don’t know.
- Day 2–3: Label charts focusing on Order Blocks and Market Structure only.
- Day 4: Practice spotting FVGs and marking POIs.
- Day 5: Do 5 micro trades on a demo account using POIs and OTE rules.
- Day 6: Review trades, journal mistakes, and re-label charts.
- Day 7: Teach someone the 5 terms you practiced and write a short summary.
FAQ — Quick Answers
Q: Is ICT Trading the only profitable trading method?
A: No. ICT is one set of concepts focused on smart money and order flow. Profitability depends on discipline, risk management, and practice. Use ICT ideas as tools rather than a guaranteed system.
Q: How many terms do I need to master?
A: Start with 3–5 core terms (Order Block, Fair Value Gap, Market Structure, POI, OTE). Once you use them confidently in charts, add more terms gradually.
Q: Can I use ICT on any market?
A: Yes — Forex, indices, commodities, and even some stocks show ICT patterns. Timeframes matter: higher timeframes (4H, Daily) give stronger signals.
Q: Do I need fancy tools or paid indicators?
A: No. Most ICT concepts are price-action based and can be applied with basic charting tools. However, many traders use level-marking tools, Fibonacci, and simple orderblock/fvg drawing tools to save time.
Conclusion & Next Steps
Understanding the language of ICT Trading turns confusing charts into understandable maps. Don’t memorize blindly — learn the meaning, relate each term to a simple analogy, and practice by labeling charts and journaling trades.